Zonal Statistics as Table
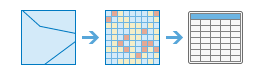
This tool summarizes the values of a raster within the zones of another dataset and reports the results to a table.
Some example application of this tool includes the following:
- Given a layer of watershed boundaries and a layer of land-use boundaries by land-use type, calculate total acreage of land-use type for each watershed.
- Given a layer of parcels in a county and a layer of city boundaries, summarize the average value of vacant parcels within each city boundary.
If Use current map extent is checked, only those features in the input layer and the layer to be summarized that are visible within the current map extent will be analyzed. If unchecked, all features in both the input layer and the layer to be summarized will be analyzed, even if they are outside the current map extent.
Choose zone raster or features
The input that defines the boundaries of the zones, or areas, that will be summarized.
The input can be an integer raster or feature data. For rasters, the zones are defined by all locations in the input that have the same cell value. For features, the zones can be overlapping. The areas do not have to be contiguous.
Zone field
The field that contains the values that define each zone.
It can be an integer or a string field of the zone dataset.
Choose value raster
The raster that contains the values on which to calculate a statistic.
It can be either integer or floating point. However, when it is floating-point type, the options for calculating majority, minority, and variety will not be available.
Ignore NoData in calculations (optional)
Specifies whether NoData values are ignored in the analysis.
- Checked—The analysis will include the cells that have a value in the input value raster within any particular zone to determine the output value for that zone. NoData cells in the value raster will be ignored in the statistic calculation. This is the default.
- Unchecked—The analysis will result in NoData if there are any NoData values for the cells of the value raster within a particular zone.
Statistics type (optional)
Specifies the statistic type to be calculated.
The input can be one of the following: All, Mean, Majority, Maximum, Median, Minimum, Minority, Percentile, Range, Standard deviation, Sum, Variety, Minimum and Maximum, Mean and Standard deviation, or Minimum, Maximum and Mean. The default is All.
Percentile values (optional)
The percentile to calculate. The default is 90, indicating the 90th percentile.
The value can range from 0 to 100. The result of specifying the 0th percentile is essentially equivalent to that of the minimum statistic, and the 100th percentile is equivalent to maximum. A value of 50 will produce essentially the same result as the median statistic.
This parameter is only supported if the Statistics type parameter is set to Percentile or All.
Percentile interpolation type (optional)
Specifies the method of percentile interpolation to be used when the number of values from the input raster to be calculated is even.
- Auto Detect—If the input value raster is of integer pixel type, the Nearest method is used. If the input value raster is of floating-point pixel type, the Linear method is used. This is the default.
- Nearest—The nearest available value to the desired percentile is used.
- Linear—The weighted average of the two surrounding values from the desired percentile is used.
This parameter is only supported if the Statistics type parameter is set to Percentile or All.
Process as multidimensional (optional)
Specifies how the input multidimensional image services will be processed if they are multidimensional.
- Checked—The statistics will be calculated from the current slice of the input multidimensional dataset. This is the default.
- Unchecked—The statistics will be calculated for all dimensions of the input multidimensional dataset.
Result table name
The name of the layer that will be created in My Content and added to the map. The default name is based on the tool name and the input layer name. If the layer already exists, you will be prompted to provide another name.
You can specify the name of a folder in My Content where the result will be saved using the Save result in drop-down box.