Find Argument Statistics
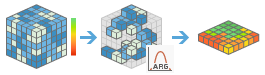
Extracts the dimension value or band index at which a given statistic is attained for each pixel in a multidimensional or multiband raster.
Use this tool to extract the dimension value (for example the date, height, or depth) at which a specific statistic is reached in the stack of rasters in a multidimensional raster dataset. Alternatively find the band number at which the statistic is reached in a multiband raster.
For example, you may want to know the month in which each pixel reached the highest sea surface temperature over 30 years of data collection. Another example is you have an eight-band remote sensing image and you want to know the band in which the minimum reflectance value was reached for each pixel.
If Use current map extent is checked, variables or bands of the layer that are visible within the current map extent will be analyzed. If unchecked, variables or bands of the full layer will be analyzed, even if they are outside the current map extent.
Choose multidimensional or multi-band imagery layer to analyze
The input multidimensional or multiband raster to be analyzed.
Choose dimension from which the statistic will be extracted
The dimension from which the statistic will be extracted. If the input raster is not a multidimensional raster, this parameter is not required.
Choose variable(s) that will be analyzed
The variable or variables to be analyzed. If the input raster is not multidimensional, the pixel values of the multiband raster are considered the variable. If the input raster is multidimensional and no variable is specified, all variables with the selected dimension will be analyzed.
For example, to find the years in which temperature values were highest, specify temperature as the variable to be analyzed. If you do not specify any variables and you have both temperature and precipitation variables, both variables will be analyzed, and the output multidimensional raster will include both variables.
Choose statistics type
Specifies the statistic to extract from the variable or variables along the given dimension.
- Argument of the minimum—The dimension value at which the minimum variable value is reached will be extracted. This is the default.
- Argument of the maximum—The dimension value at which the maximum variable value is reached will be extracted.
- Argument of the median—The dimension value at which the median variable value is reached will be extracted.
- Argument of duration—The longest dimension duration for which the variable values fall between the minimum and maximum values.
Specify multiple occurrence value
The pixel value to use to indicate that a given argument statistic was reached more than once in the input raster dataset. If not specified, the pixel value will be the value of the dimension the first time the argument statistic is reached.
Specify minimum value
The minimum variable value to be used to extract the duration.
This parameter is required when Duration is selected as the statistics type.
Specify maximum value
The maximum variable value to be used to extract the duration.
This step is required when Duration is selected as the statistics type.
Choose dimension definition
Specifies how the statistic will be extracted from the dimension.
- All—The statistic will be extracted across all dimensions. This is the default.
- Interval Keyword—The statistic will be extracted from the time dimension according to the interval keyword.
Choose keyword interval
The unit of time for which the statistic will be extracted.
For example, you have five years of daily sea surface temperature data and you want to know the year in which the maximum temperature was observed. Set Argument of the maximum as the statistics type, set Interval Keyword as the dimension definition, and set Yearly as the keyword interval in this step.
Alternatively, if you want to know the month in which the maximum temperature was consistently observed, set Argument of the maximum as the statistics type, set the Interval Keyword as the dimension definition, and set Recurring Monthly as the keyword interval in this step. This will generate a raster in which each pixel contains the month in which the statistic was reached across the five-year record (08/18/2018, 08/25/2016, 08/07/2013, for example).
This step is required when StdTime is set as the dimension from which the statistic will be extracted, and Interval Keyword is selected to define how the statistic will be extracted from the time dimension .
- Recurring daily— The statistic will be extracted across days.
- Recurring weekly—The statistic will be extracted across weeks.
- Recurring monthly—The statistic will be extracted across months.
- Recurring quarterly—The statistic will be extracted across quarters.
- Hourly—The statistic will be extracted for the hour in which the statistic was reached.
- Daily—The statistic will be extracted for the day in which the statistic was reached.
- Weekly—The statistic will be extracted for the week in which the statistic was reached.
- Monthly—The statistic will be extracted for the month in which the statistic was reached.
- Quarterly—The statistic will be extracted for the quarter in which the statistic was reached.
- Yearly—The statistic will be extracted for the year in which the statistic was reached.
Ignore missing values in calculation
Specifies whether missing values are ignored in the analysis.
- If the box is checked, the analysis will include all valid pixels along a given dimension and ignore any NoData pixels. This is the default.
- If the box is unchecked, the analysis will result in NoData if there are any NoData values for the pixel along the given dimension.
Result layer name
The name of the layer that will be created in My Content and added to the map. The default name is based on the tool name and the input layer name. If the layer already exists, you will be prompted to provide another name.
You can specify the name of a folder in My Content where the result will be saved using the Save result in drop-down box. If you have the privileges to create both tiled and dynamic imagery layers, you can specify which layer type to generate in the output using the Save result as drop-down box.