Aggregate Multidimensional Raster
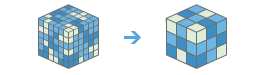
Generates a multidimensional raster dataset by combining existing multidimensional raster variables along a dimension.
If you have 30 years of sea surface temperature data, collected monthly and at every 5 meters depth up to 100 meters, some example applications are the following:
- Aggregate monthly temperature data into yearly data.
- Aggregate monthly temperature data into 4-month intervals.
- Aggregate temperature data from 0 to 25 meters, then from 25 to 50 meters, then from 50 to 100 meters.
If Use current map extent is checked, variables of the layer that are visible within the current map extent will be analyzed. If unchecked, variables of the full layer will be analyzed, even if they are outside the current map extent.
Choose multidimensional imagery layer to aggregate
The input imagery layer of a multidimensional raster that will be aggregated.
Choose dimension along which to aggregate
The aggregation dimension. This is the dimension along which the variables will be aggregated.
Choose variable(s) to aggregate
The variable or variables that will be aggregated along the given dimension. If no variable is specified, all variables with the selected dimension will be aggregated.
For example, to aggregate your daily temperature data into monthly average values, specify temperature as the variable to be aggregated. If you do not specify any variables and you have both daily temperature and daily precipitation variables, both variables will be aggregated into monthly averages and the output multidimensional raster will include both variables.
Choose aggregation method
Specifies the mathematical method that will be used to combine the aggregated slices in an interval.
- Mean—Calculates the mean of a pixel's values across all slices in the interval. This is the default.
- Maximum—Calculates the maximum value of a pixel across all slices in the interval.
- Majority—Calculates the value that occurred most frequently for a pixel across all slices in the interval.
- Minimum—Calculates the minimum value of a pixel across all slices in the interval.
- Minority—Calculates the value that occurred least frequently for a pixel across all slices in the interval.
- Median—Calculates the median value of a pixel across all slices in the interval.
- Percentile—The percentile of values for a pixel will be calculated across all slices in the interval. The 90th percentile is calculated by default. You can specify other values (from 0 to 100) using the Percentile value parameter.
- Range—Calculates the range of values for a pixel across all slices in the interval.
- Standard Deviation—Calculates the standard deviation of a pixel's values across all slices in the interval.
- Sum—Calculates the sum of a pixel's values across all slices in the interval.
- Variety—Calculates the number of unique values of a pixel across all slices in the interval.
- Custom—Calculates the value of a pixel based on a custom raster function.
Choose raster function template
A custom raster function that will be used to compute the pixel values of the aggregated rasters. The input is a raster function template item in portal. This input is required when Aggregation Method is set to Custom.
Choose aggregation definition
Specifies the dimension interval for which the data will be aggregated.
- All—The data values will be aggregated across all slices. This is the default.
- Interval Keyword—The variable data will be aggregated using a commonly known interval.
- Interval Value—The variable data will be aggregated using a user-specified interval and unit.
- Interval Ranges—The variable data will be aggregated between specified pairs of values or dates.
Choose keyword interval
Specifies the keyword interval that will be used when aggregating along the dimension. This input is required when Aggregation Definition is set to Interval Keyword, and the aggregation must be across time.
- Hourly—The data values will be aggregated into hourly time steps, and the result will include every hour in the time series.
- Daily—The data values will be aggregated into daily time steps, and the result will include every day in the time series.
- Weekly—The data values will be aggregated into weekly time steps, and the result will include every week in the time series.
- Monthly—The data values will be aggregated into monthly time steps, and the result will include every month in the time series.
- Quarterly—The data values will be aggregated into quarterly time steps, and the result will include every quarter in the time series.
- Yearly—The data values will be aggregated into yearly time steps, and the result will include every year in the time series.
- Recurring Daily—The data values will be aggregated into daily time steps, and the result will include one aggregated value per Julian day. The output will include, at most, 366 daily time slices.
- Recurring Weekly—The data values will be aggregated into weekly time steps, and the result will include one aggregated value per week. The output will include, at most, 53 weekly time slices.
- Recurring Monthly—The data values will be aggregated into weekly time steps, and the result will include one aggregated value per month. The output will include, at most, 12 monthly time slices.
- Recurring Quarterly—The data values will be aggregated into weekly time steps, and the result will include one aggregated value per quarter. The output will include, at most, 4 quarterly time slices.
- Dekadly— The data values will be aggregated into 3 periods of 10 days each. The last period might contain more or fewer than 10 days. The output will include 3 slices for each month.
- Pentadly—The data values will be aggregated into 6 periods of 5 days each. The last period might contain more or fewer than 5 days. The output will include 6 slices for each month.
Value Interval
The size of the interval that will be used for the aggregation. This parameter is required when the Aggregation Definition parameter is set to Interval Value.
For example, to aggregate 30 years of monthly temperature data into 5-year increments, enter 5 as the Value Interval, and specify Unit as Years.
Unit
The unit that will be used for the interval value. This input is required when the Dimension is a time field and Aggregation Definition is set to Interval Value.
If you are aggregating over anything other than time, this option will not be available and the unit for the interval value will match the variable unit of the input multidimensional raster data.
- Hours—The data values will be aggregated into hourly time slices at the interval provided.
- Days—The data values will be aggregated into daily time slices at the interval provided.
- Weeks—The data values will be aggregated into weekly time slices at the interval provided.
- Months—The data values will be aggregated into monthly time slices at the interval provided.
- Years—The data values will be aggregated into yearly time slices at the interval provided.
Define ranges
Interval ranges will be used to aggregate groups of values. They consist of pairs of minimum and maximum range values, with data type Double or Date. This input is required when Aggregation Definition is set to Interval Ranges.
Ignore missing values in calculation
Specifies whether missing values are ignored in the analysis.
- Checked—The analysis will include all valid pixels along a given dimension and ignore any NoData pixels. This is the default.
- Unchecked—The analysis will result in NoData if there are any NoData values for the pixel along the given dimension.
Result layer name
The name of the layer that will be created in My Content and added to the map. The default name is based on the tool name and the input layer name. If the layer already exists, you will be prompted to provide another name.
You can specify the name of a folder in My Content where the result will be saved using the Save result in drop-down box. If you have the privileges to create both tiled and dynamic imagery layers, you can specify which layer type to generate in the output using the Save result as drop-down box.
Percentile value
The percentile to calculate. The default is 90, indicating the 90th percentile.
The values can range from 0 to 100. The 0th percentile is essentially equivalent to the minimum statistic, and the 100th percentile is equivalent to maximum. A value of 50 will produce essentially the same result as the median statistic.
Percentile interpolation type
Specifies the method of percentile interpolation that will be used when there is an even number of values from the input raster to be calculated.